TLDR
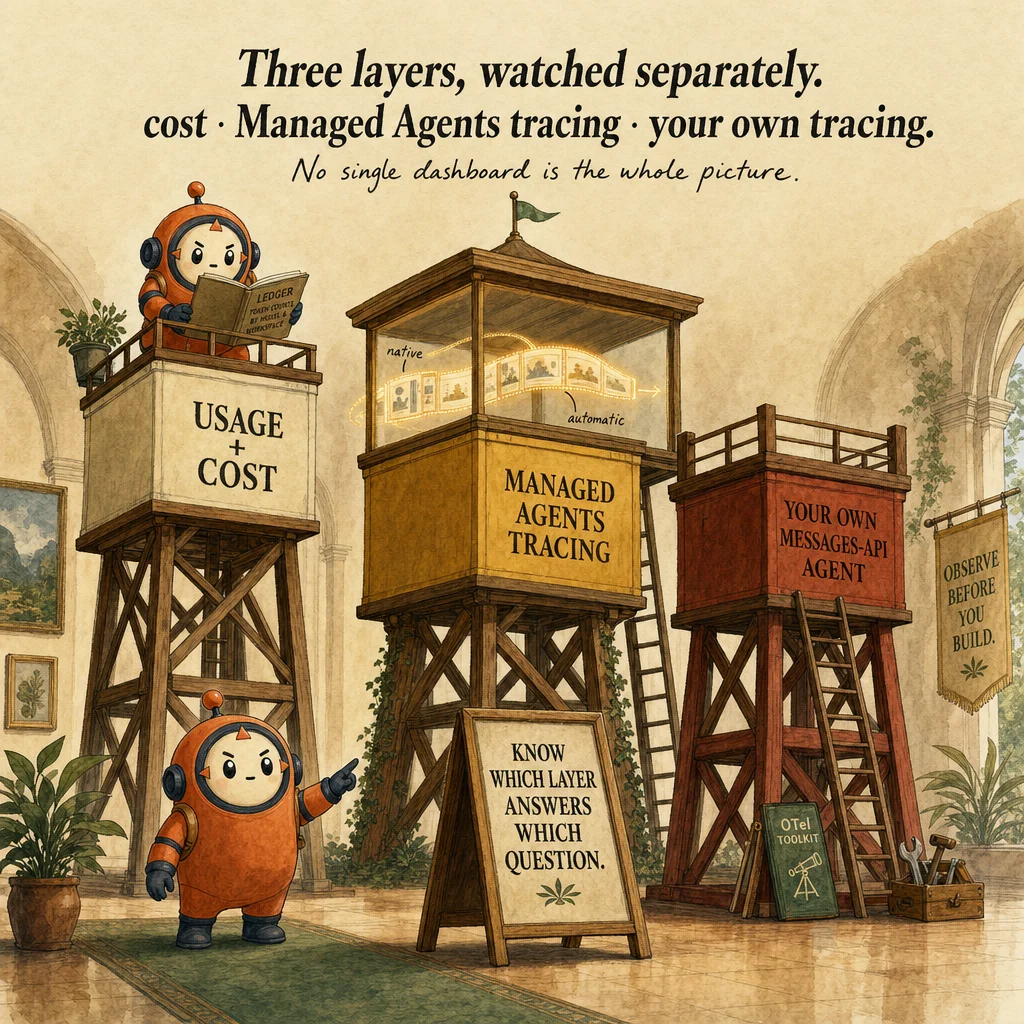
Observability for a Claude agent fleet spans layers you must monitor separately: platform-level usage/cost accounting (Anthropic's Admin/Analytics APIs), Managed Agents session tracing (a Console Tracing view plus native span events, scoped to agents run on that platform), and application-level execution tracing for a self-orchestrated agent built directly against the Messages API, where Anthropic does not natively provide distributed tracing. The exam trap is treating any one dashboard as "the whole observability solution" instead of naming which layer actually answers the question at hand. Anthropic Usage & Cost Admin API + Managed Agents observability docs
What it is
Observability for a Claude-based agent fleet spans layers an architect must monitor separately: platform-level usage/cost accounting (what Anthropic exposes natively across all API usage), Managed Agents session tracing (a Console Tracing view plus native span events, native to agents run on the Managed Agents platform specifically), and application-level execution tracing for an agent an architect orchestrates themselves directly against the Messages API, a layer Anthropic does not natively instrument.
That last gap is exactly the "observability challenge at scale" this objective tests: a single request's console log tells you little about why a multi-agent pipeline degraded across thousands of concurrent runs, and Managed Agents tracing does not help if the agent in question is not running on that platform. A scalable monitoring strategy layers execution tracing on top of, not instead of, the native cost APIs, and picks the right native tracing tool for the runtime the agent actually executes on.
How it works
Anthropic's Usage & Cost Admin API gives an organization granular historical usage/cost data - token counts (uncached input, output, cache creation/reads), usage by model/workspace/API key, and cache-efficiency analysis - intended for cost reconciliation and chargeback reporting, across all API usage regardless of runtime.
Two separate Analytics APIs exist and are easy to confuse. The Claude Code Analytics API (developer productivity metrics, via an Admin API key) is distinct from the Claude Enterprise Analytics API (org-wide chat/Projects/Code engagement and adoption, via a claude.ai Analytics API key) - architects must provision the correct one for what they're actually trying to observe.
Managed Agents now ships native session tracing. Managed Agents sessions emit session, span, and agent events (e.g. span.model_request_start / span.model_request_end) for observability into agent progress, and the Console's Managed Agents section renders a session list plus a Tracing view - a chronological, step-level replay of what a given session did (content, tool calls and results, timestamps, token usage), restricted to Developers/Admins. This closes the execution-tracing gap for agents that run on the Managed Agents platform - it does not extend to a self-built agent loop calling the raw Messages API directly.
Anthropic does not natively provide distributed tracing for a self-orchestrated agent built directly on the Messages API (your own agent loop, not a Managed Agents session). This remaining gap is filled by the vendor-neutral OpenTelemetry GenAI semantic-conventions project, which as of 2026 defines a versioned span model for agent traces (inference, embeddings, retrieval, memory, execute-tool spans) - still labeled "Development" status, so span names can change. The Claude Agent SDK / Claude Code CLI also ships built-in OTel instrumentation, recording spans around each model request and tool execution independent of Managed Agents.
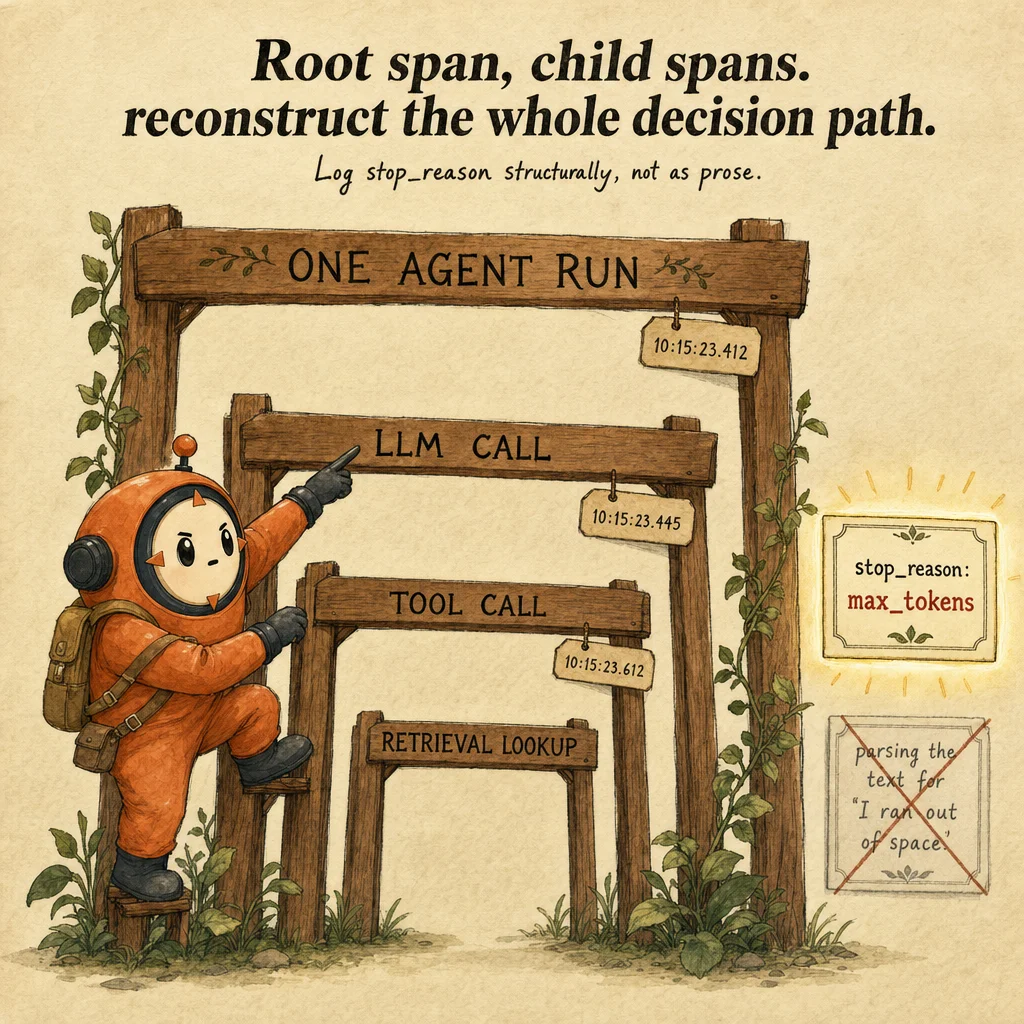
The recommended OTel pattern (for the Messages-API-direct case Managed Agents tracing doesn't cover): wrap each agent run in a root span, nest a child span per LLM call/tool call/retrieval lookup, so a single trace reconstructs the full decision path an agent took - the shape that scales past "read one console log." Pair this with structured, per-turn logging of stop_reason (max_tokens vs end_turn) so silent truncations are distinguishable from clean completions at the dashboard level, not just in individual transcripts.
Third-party LLM observability platforms (Langfuse, Helicone, Datadog LLM Observability, and others) build on top of or alongside these OTel conventions to add prompt/response logging, eval scoring, and cost dashboards purpose-built for LLM apps - a reasonable augmentation layer where Anthropic's native tooling (Managed Agents tracing included) stops.
Where you'll see it
Multi-agent research pipeline (Messages API, self-orchestrated)
Usage & Cost API for per-model spend attribution to finance; an OTel root span per research task with child spans per subagent/tool call so an on-call engineer can pinpoint a stalled subagent.
Multi-agent research pipeline (Managed Agents)
Same Usage & Cost API for spend, but execution debugging uses the Console's native Managed Agents Tracing view instead of hand-rolled OTel spans - no manual instrumentation needed for the traced session itself.
Silent-truncation debugging
Structured stop_reason logging per turn distinguishes max_tokens truncation from clean end_turn completion at the dashboard level, not just in individual transcripts.
Side-by-side
| Layer | What it answers | Tooling | Gap |
|---|---|---|---|
| Usage & Cost Admin API | What did this cost, by model / workspace / key? | Anthropic native | No per-request execution detail |
| Claude Code Analytics API | Developer productivity metrics | Admin API key | Not org-wide chat/adoption data |
| Claude Enterprise Analytics API | Org-wide chat / Projects / Code engagement | claude.ai Analytics API key | Not execution tracing |
| Managed Agents Console Tracing view | Why did this specific Managed Agents session fail, several tool calls deep? | Anthropic native (span events + Console UI, Dev/Admin access) | Scoped to Managed Agents sessions - not a self-built Messages API agent loop |
| OTel GenAI distributed tracing | Same question, for a self-orchestrated Messages-API agent | Vendor-neutral; still "Development" status | You instrument it yourself |
| Third-party LLM observability (Langfuse / Helicone / Datadog) | Prompt/response logs, eval scoring, cost dashboards | Builds on/alongside OTel | Adds a vendor dependency; verify feature parity |
Question patterns
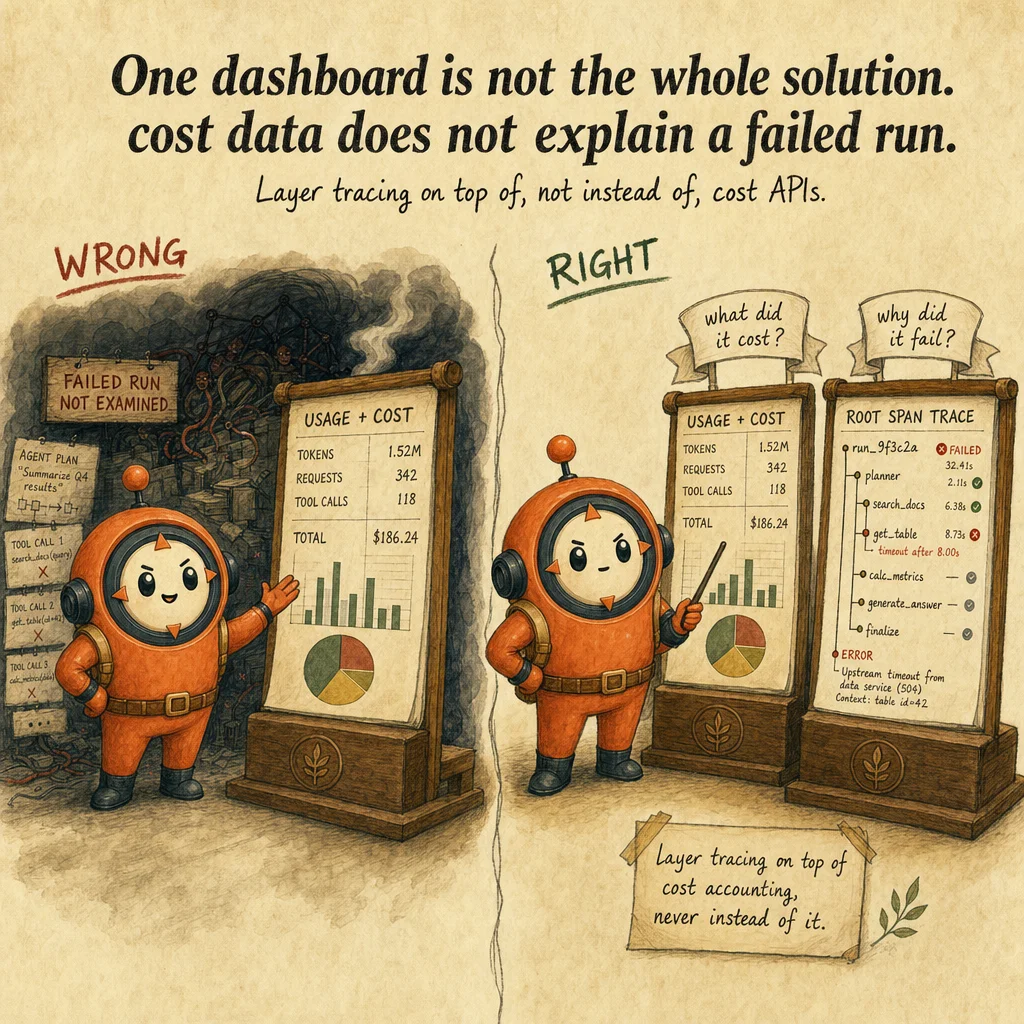
A finance team pulls the Usage & Cost Admin API dashboard and declares the multi-agent pipeline 'fully observable.' What's missing?
"nothing - usage data is the complete observability picture" conflates cost accounting with execution tracing, exactly the trap this objective tests.An architect provisions a Claude Enterprise Analytics API key expecting to see per-developer Claude Code productivity metrics. What went wrong?
"both APIs return identical data, so either key works" is false - they are scoped to different questions and different key types.A 10,000-request/day research pipeline, built as a self-orchestrated agent loop directly against the Messages API (not Managed Agents), needs to pinpoint which of 4 subagent types stalled in one specific failed run. What's the recommended pattern?
"increase console log verbosity for all requests" does not scale past reading one log at a time and does not reconstruct a multi-agent decision path.The same research pipeline is instead built and run as a Managed Agents session. An engineer says they still need to hand-instrument OTel spans to debug a failed run. Are they right?
span.model_request_start/span.model_request_end) and the Console's Managed Agents Tracing view already gives a step-level, chronological replay of that session's tool calls and model outputs, no manual instrumentation required. The distractor "Anthropic never natively traces agent execution, so OTel is always required" is now outdated - it was true for a self-built Messages API loop but not for Managed Agents sessions specifically.A team pins to the OTel GenAI semantic-conventions span names in production and later finds span names changed in a newer spec release. Why did this happen?
"OTel GenAI conventions are a stable v1.0 standard Anthropic maintains" is wrong on both counts: it is vendor-neutral and still in Development status.A dashboard shows a spike in agent turns ending without a tool result. Which structured signal should the logging layer capture to distinguish a silent truncation from a clean stop?
stop_reason field per turn, logged structurally (e.g. max_tokens vs end_turn), so truncations are distinguishable at the dashboard level, not just visible in individual transcripts. The distractor "parse the response text for phrases like 'I ran out of space'" repeats the natural-language-parsing anti-pattern this exam content flags elsewhere - text is not a reliable structured signal.Frequently asked
Does Anthropic provide built-in distributed tracing for multi-agent pipelines?
Which Analytics API do I need for developer productivity vs org-wide adoption?
Work this with your AI
Work this concept hands-on with Claude Code, Codex, or claude.ai. Copy a prompt, paste it into your assistant, and practise in tandem. Each one keeps you active (explain it back, get drilled, or build) rather than just reading.
- Drill it like the exam (scenario MCQs)Practice in the exam's scenario-MCQ format with trap awareness.
- Explain it back (Feynman)Build durable, transferable understanding of a concept you can half-state.
- Test me, adapting the difficultyActive recall practice on a concept you think you know.
- Check my prerequisites firstBefore studying a concept that keeps not sticking.
- Find the high-leverage 20%When a domain feels too big and you are short on time.